Track Power BI reports
External to the Track application, Sorted provide our Track customers with access to a variety of service reports created in Microsoft’s Power BI.
These are handy reports which can be used to monitor various aspects of Track’s usage and delivery data over time.
Note
The reports are updated every 24 hours to include the previous day's data .For more information, please contact your account manager.
If you want to know about a particular report, click the links below for more information:
- Overview Dashboard
- Shipments Registered
- Customer Promise Met
- Customer Promise Not Met
- Webhooks
- Dashboard Views
- Tracking Page View
- Tracking Events
- Processed Events
- Files Received
- Notifications Sent
Each report can be accessed by clicking the list to the left of the Power BI reports page.
Alternatively, you can access each report by clicking the tiles in the Overview dashboard report.
View below for information on how to interact with each report and how to filter data by various sources. Otherwise, scroll down to Reports Available for a breakdown of each report.
Note
If you're a Track user and have not been provided access to your Power BI reports, please contact your account manager.
Filter by date range
Each report displays the data set between two date ranges.
These dates can be customised to specific dates of your choosing.
To select the dates yourself:
- Click the report you want to view.
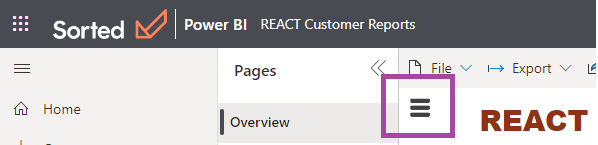
- Click the ‘burger menu’ icon on the report.
- Click the start/end dates you want to change. A calendar dropdown will appear.
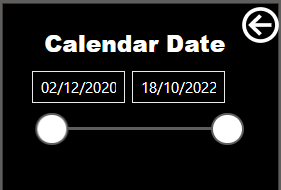
The data will modify to fit within the dates you select.
Filter by carrier(s)
Some reports have the additional filter option to display data specific to carrier(s).
If carrier filtering is available in the report, you will notice a Carrier option when you click the burger menu.
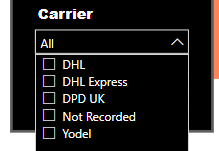
If you want to show or hide data of various carriers, hold the ‘Ctrl’ button on your keyboard and click the boxes to select the carrier data you want to display.
Filter by weekday(s)
Some reports have the additional filter option to display data specific to days of the week.
If this is available in the report, you will notice colourful tiles in the top-right of the report displaying the percentage days of the week.
You can filter the report to by clicking the tiles to filter the data by selected days.
Hold ‘Ctrl’ + left-click to select multiple days.
What reports are available?
We've produced a number of reports in Power BI to help provide transparent data usage in Track including delivery data, notifications and tracking page data.
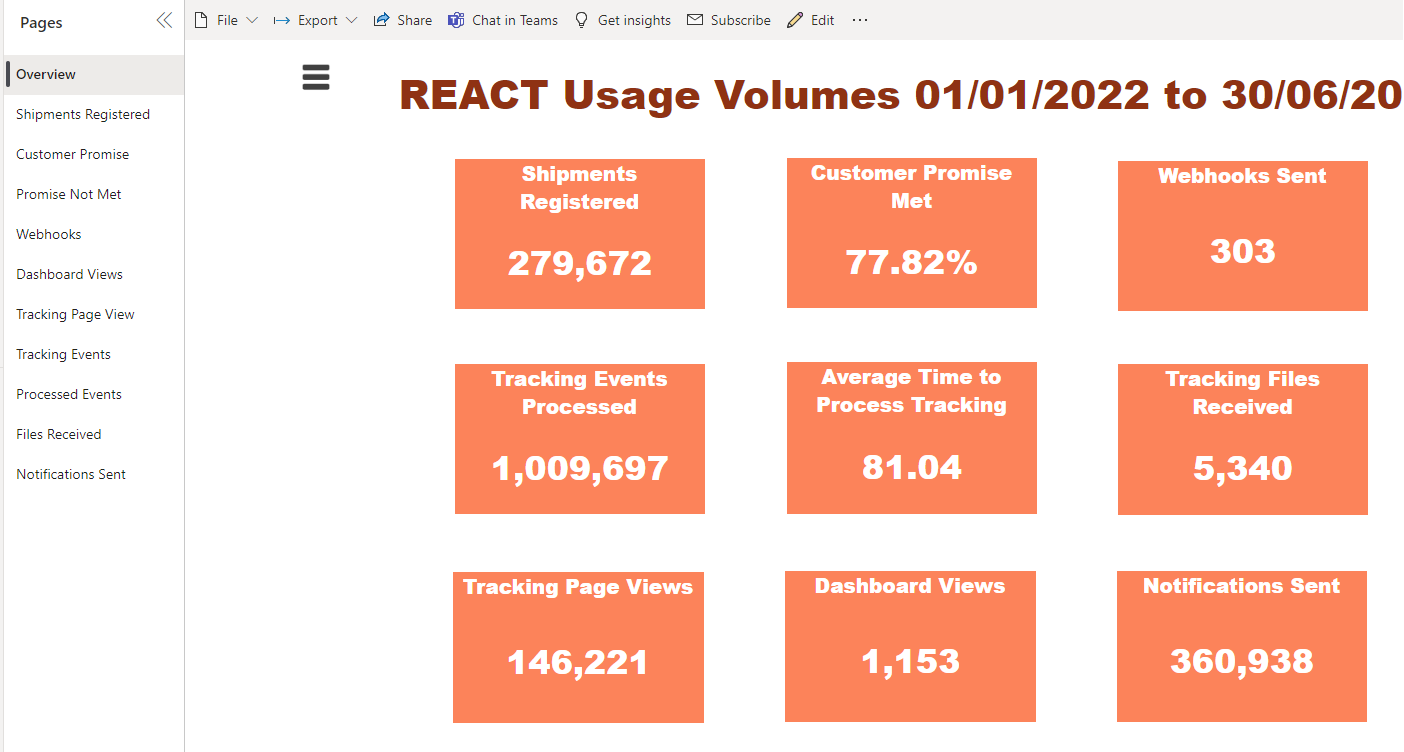
Overview
The Overview report is a dashboard of the primary data that each report represents.
Click each tile to access the report with further details on that dataset.
Shipments registered
The Shipments Registered report displays all shipments that have been processed by Track.
This includes the total shipments that have been registered through API, Email and SFTP.
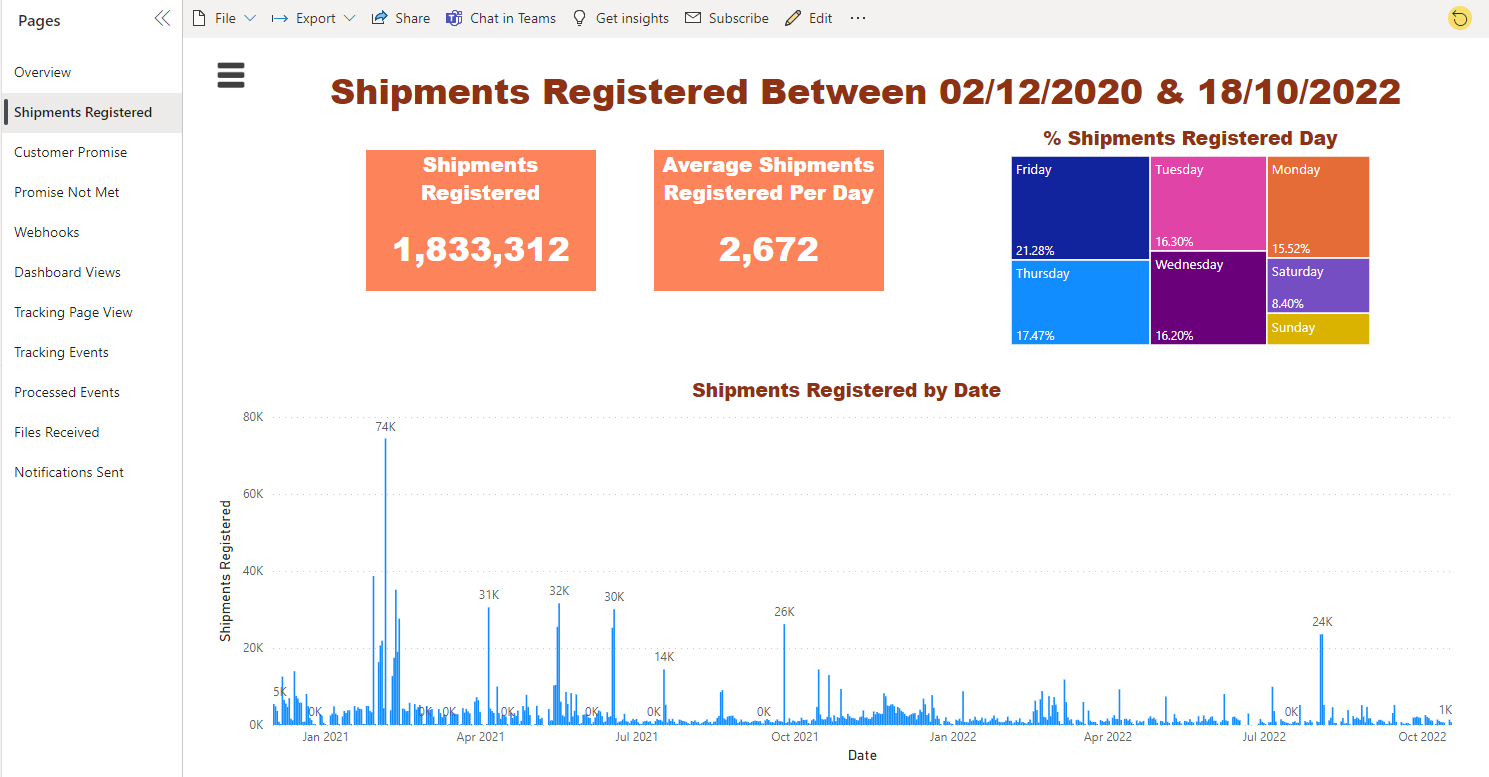
Filter options are available in this report to select by date range, filter by carrier(s) and by selected day(s) of the week. Click the links to find out more.
Additional useful data in the report includes:
- The Average Shipments Registered Per Day in your chosen date range
- Percentage breakdown of Shipments Registered Day Displays** the percentage shipments processed on each day of the week
Customer promise
The Customer Promise report breaks down all deliveries that have met the intended promised date when the shipment was registered.
Filter options are available in this report to select by date range and filter by carrier(s). Click the links to find out more.
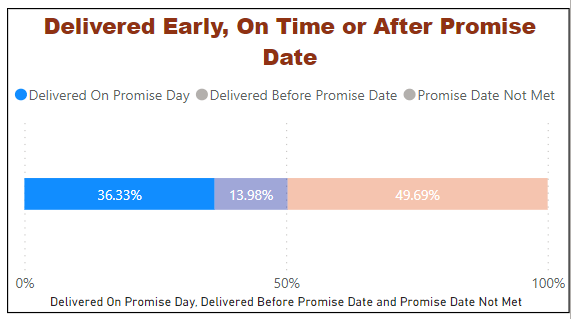
Promise met v promise not met The promise data is collated into an even split of deliveries that have ‘met’ or ‘not met’ the promise date however, included in Promise Met is also deliveries that have arrived early.
A breakdown of this data is displayed in the top-right report which shows the split of Delivered on Promise Day, Delivered Before Promise Date and Promise Date Not Met.
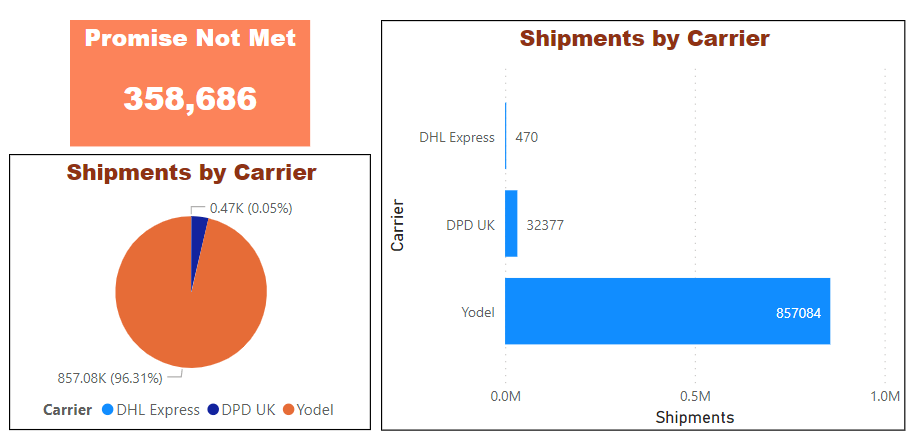
Promise Not Met
The Promise Not Met report shows the deliveries which have not met the initial stated promise date.
Filter options are available in this report to select by date range and filter by carrier(s). Click the links to find out more.
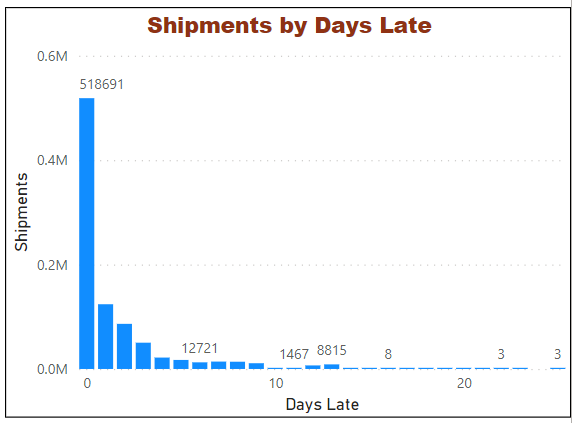
Included in the report are the following visual datasets:
The number of shipments split by the Carrier, both in pie chart and bar graph format
A bar graph displaying the number of shipments and how many days late past the initial promise date it fell.
Note
Please note, the Promise not met report is not an indication of Carrier performance and if they are responsible for the promise date not being met. This promise date can be missed for a number of reasons and is not always the responsability of the carrier.
Webhooks
The Webhooks report is summary count of total webhook usage in Track overtime.
Filter options are available in this report to select by date range, filter by carrier(s) and by selected day(s) of the week. Click the links to find out more.
Additional useful data in the report includes:
- The Average Number of Webhooks Sent Per Day
- Percentage breakdown of Webhooks Sent by Day
- Webhooks Sent by Date
Dashboard views
The Dashboard Views report shows the total dashboard views on the Track application. This is counted each time a user on Track logs in and views the dashboard page.
Filter options are available in this report to select by date range. Click the link to find out more.
Additional useful data in the report includes:
- The Average Number of Dashboard Views Per Day
- Percentage breakdown of Dashboard Views by Day
- Webhooks Sent by Date
Tracking page view
The Tracking Page View report is the total page views each time an email or SMS tracking notification is sent to a recipient.
Filter options are available in this report to select by date range, filter by carrier(s) and by selected day(s) of the week. Click the links to find out more.
Additional useful data in the report includes:
- The Average Number of Tracking Page Views Per Day
- Percentage breakdown of Tracking Page Views by Day
- Tracking Page Views by Date
Tracking events
The Tracking Events report shows the number of events that were processed between the two date ranges.
Filter options are available in this report to select by date range and filter by carrier(s). Click the links to find out more.
Additional useful data in the report includes:
- The Average Number of Tracking Events Per Day
- The Average Time to Process figure is how long it took Track to process the event
Processed events
The Processed Events report displays the total tracking events processed through Track.
Filter options are available in this report to select by date range and filter by carrier(s). Click the links to find out more.
Additional useful data in the report includes:
- The Average Time to Process an event
- The Tracking Events Processed by Date and Carrier
- Average Time to Process by Date and Carrier Name
Files received
The Files Received report displays the total files received by Carriers in a given date range.
Filter options are available in this report to select by date range and filter by carrier(s). Click the links to find out more.
Additional useful data in the report includes:
- The Date and Time Files Received
- The Average Events Per Hour by Hour of the Day
- The Hour of Day Files Received
Notifications sent
The Notifications Sent report shows the number notifications that were sent between the two date ranges. This includes notifications that were sent by both Email and SMS.
Filter options are available in this report to select by date range, filter by carrier(s) and by selected day(s) of the week. Click the links to find out more.
Additional useful data in the report includes:
- Average Number of Notifications Send Per Day
- The percentage of Notifications Sent by Day
- Notifications Sent by Date
Note
For more information on reporting, please contact your account manager.
Next steps
Check out some of our following articles: